- 6 Posts
- 15 Comments

The way statistical sampling works, 1000 people in a population of 300,000,000 is actually good enough for most things. You can play around with numbers here to convince yourself, but at 95% confidence 1000 people will give an answer to within 3% of the true answer for the 300,000,000 population.

Suddenly trying to convince all my friends and family I’m from France.
YMYDYMYD
Lol, I’m sorry you’re getting downvoted for speculating about improving weights and measures in a thread about wanting better weights and measures.
I kinda thought the title made it clear I was an American.
DST is good actually. Fite me.


 2·5 months ago
Hard agree! Those are rookie numbers. We gotta pump those numbers up! It’s my understanding that 5 member districts is the smallest you can go and still be functionally impossible to gerrymander.
 2·5 months ago
Hi, Bob!
You’re putting words in my mouth both by extending things I said into areas I didn’t go, and straight-up misremembering a claim I did make to the point where your quote isn’t even a factual statement independent of the fact that I didn’t say it. Furthermore, it is clear you don’t fully understand how RCV actually works, which is messing with quite a bit of your logic and messing with your interpretations of statements I’ve made.
Cheers mate, I wish you didn’t see me as an adversary.
Yeah I mean, voting data is messy. You’re trying very hard to interpret the data in only the way you want to. You’re the one who claims 50% picking 1 out of 4 doesn’t conform to expectations. I think that’s perfectly acceptable. If you look at the Democratic Primary Polling Data again, you’ll find that, in practice, RCV, Approval, and Score generally agree on the overall results. You seem to think that voters choosing only some candidates is somehow a failure of the system. How many do you want them to pick before it’s an acceptable number?
I made sure not to make claims about the sources unless they were true. It would be ridiculous to do otherwise. You’re taking claims I made elsewhere and applying them to things I didn’t point to. I have read and understood the entirety of every link I shared. I’m not going to be posting things I can’t explain. Different sources have different purposes, to dive into to details if each (which do not always agree with each other) would be further complicating an already nitpicky argument. You asked for more variation in sources, I provided more variation in sources. What would have been an acceptable but not excessive number?
You claimed you easily created nonsensical models, but have failed to produce your examples. You’re the one who has to provide proof of your claims, because just like you said, I can’t prove a negative. I already provided a graphical example of RCV misbehaving. Can you provide an example of the others?
You keep claiming we have plenty of data on RCV but then don’t reference any of it. Typically election officials don’t release the ballots, so it’s impossible to actually say what kind of election happened under RCV. The spoiler rate estimates for RCV elections are all over the place.
You’ve got the definition of a spoiler wrong. Spoiler candidates are a losing candidate that changes the winner of the race without a change in voter preferences. If you let voter opinions change, anything you try to say about the voting system is virtually meaningless.
Anyway dude, you’re clearly not interested in having a productive conversation. The only reason I’m replying is to make sure at least some of your assumptions and wrong claims are publicly countered, but at this point I really am going to say goodbye. I get the feeling that you’d somehow argue I didn’t address half your points but also gave a wall of text.
Say what you want, I’m done. I again wish you and the RCV crowd well (it’s not a terrible system) and hope we have some epic national stage showdown in the future.
If 50% of voters picking 1 person out of 4 is “most,” then “most” people also voted for 2 or 3 out of 4. I shouldn’t have to point out that you can’t really have two exclusive groups both claiming “most.”
I’m using CES so heavily because they’re the ones with good data and write-ups, but I can dump more data from other sources if you’re interested.
A different interactive simulation where RCV usually agrees with the minority. Notice that it also fails to even be resolvable with certain opinions and so doesn’t get calculated at all.
RCV can hide second choices when first choices win or make it to the finals. Arguing that’s the correct result under RCV is circular reasoning, and the results fail to show the true support of the other candidates, which is important for future elections, where people judge who to vote for based on past results.
2023 Chicago Mayor election, multiple voting method polling data. Yes, the sampling method produced bias in the responses. The takeaway is not found in absolute, but comparative results.
Higher dimensional election modeling.
The spoiler rate under RCV is not insignificant, and at the very least, difficult to understand. Your voting method should not be difficult to understand. Do you want even more claims of a stolen election? That’s how you get even more claims of a stolen election.
The incentive to vote for one person also incentivizes you to cast a safety vote. You can’t have it both ways. Either the system will encourage people to vote for a candidate they don’t like, or it will encourage people to only vote their favorite. It can’t do both.
Also, can you show me those nonsensical spacial models under approval? I tried to create one and failed. If you create one, can you show the results for all four methods with that same candidate set?
Anyway, I don’t think we’re going to be having a productive conversation beyond this. I sincerely hope that RCV continues succeeding, despite its flawed nature, I think we can both degree it’s better than our current system. I hope both approval and RCV take over the country and are forced into an ultimate showdown.
Cheers!
That’s not what they did in the 2020 primary. Only a small number of people cast safety votes for Biden when they were given them freedom to vote for as many people as the liked.
RCV fails the Sincere Favorite Criterion. People claim that it’s safe to vote honestly under RCV, but that’s actually not true. Sometimes you’re better-off by demoting your favorite or even not voting at all This stems from RCV’s non-monotonicity problem, where increasing support for a candidate can cause them to do worse (or vice versa). This is an unacceptable failure.
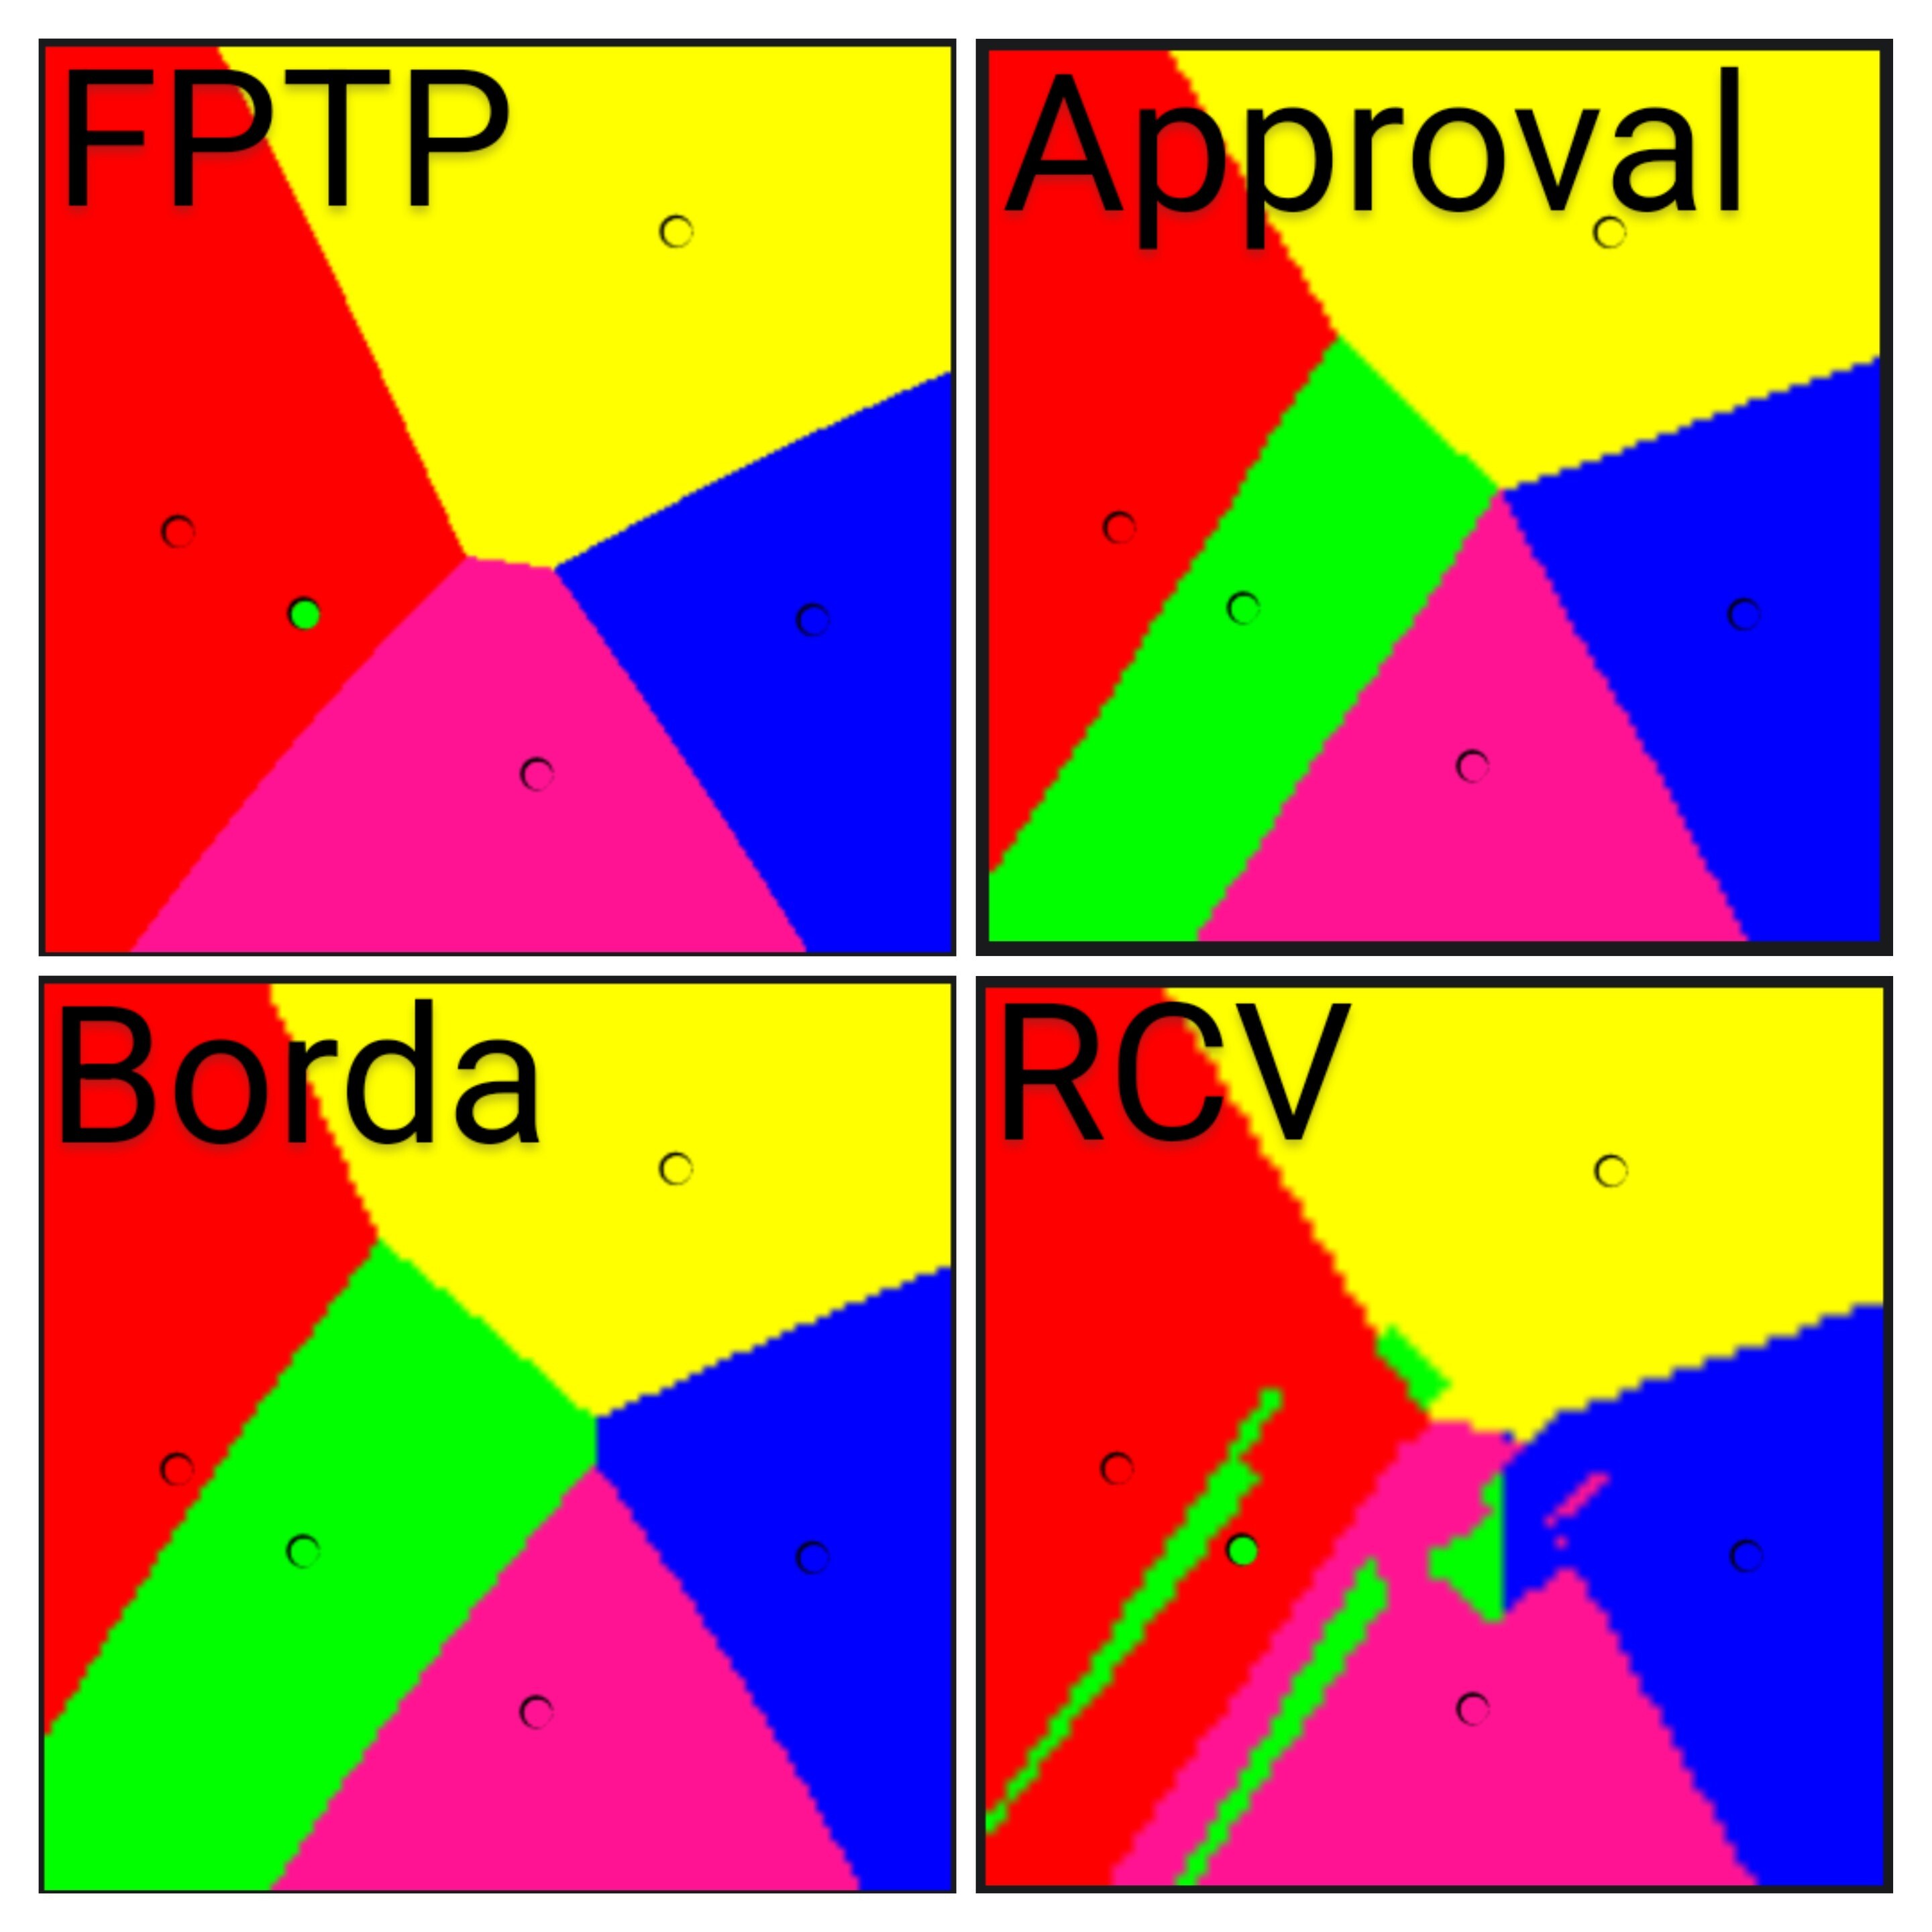
If you want to see some of the whacky results RCV can produce, play around with this spacial election simulation tool. I’m not kidding when I say this is the first result I got, which I set up in literally five seconds while blind to the RCV calculation. The green candidate has three completely separate win regions and they’re not even inside any of them. When green is obviously the most popular candidate, they lose. That’s completely unacceptable.
I’m not sure what you’re on about with approval voting having extra steps compared to choose one. If anything, RCV is the one with extra steps. Even in the previous link, RCV is noticably slower to calculate.
Approval is used in both Fargo and St. Louis. The number of votes people tend to cast depends on how many candidates are running. The 2021 St. Louis primary had 4 candidates and voters averaged 1.56 votes cast. Since it would be moronic to vote for all 4 candidates, a likely vote distribution would have been something like 50% 1 vote, 40% 2 votes, 10% 3 votes. The 2022 Fargo election had similar results, with elections averaging 1.6 and 3 votes per ballot. In large fields, you can get some very high number of votes.
It’s popular, it’s accurate, it’s simple as hell.

 1·1 year ago
For the life of me, I will never understand why people want anything more complicated than approval voting.
Okay, yes, I understand. But still, I don’t. So simple. So easy. Approval!
I mean, yeah, 1000 people is enough assuming there’s no sampling bias. But if you’ve got sampling bias, increasing the sampling size won’t actually help you. The issue you’re talking about is unrelated to how many people you talk to.
Your own suggestion of splitting up the respondents by state would itself introduce sampling bias, way over sampling low population states and way under sampling high population states. The survey was interested in the opinions of the nation as a whole, so arbitrary binning by states would be a big mistake. You want your sampling procedure to have equal change of returning a response from any random person in the nation. With a sample size of 1000, you’re not going to have much random-induced bias for one location or another, aside from population density, which is fine because the survey is about USA people and not people in sub-USA locations.